一、介绍
HAMi-WebUI项目官网:https://github.com/Project-HAMi/HAMi-WebUI
根据官网的介绍,它是一个基于开源项目HAMi的另一开源项目,主要用来管理与监视GPU等加速设备资源的。它通过提供一个可视化的web接口扩展了HAMi的功能与可用性,这个web接口可以查看与管理跨节点的GPU资源分配与使用情况。HAMi-WebUI支持针对任务与GPU使用细节的查看,使得团队人员能高效地查看与监控相关资源的使用与消耗情况,更好地进行团队协作开发、更加便捷与充分使用相关资源。它具体提供如下4个功能:
资源概览:
提供所有资源的综合视图,包括节点和显卡的资源使用情况。快速评估所有节点和显卡的状态。节点管理:
浏览详细的节点信息,包括节点状态、资源使用情况。显卡管理:
可视化各节点的显卡使用情况,详细展示算力与显存的分配与使用。任务管理:
追踪任务及其资源消耗。查看任务创建时间、状态、显卡分配等信息。
二、部署
部署文档:https://github.com/Project-HAMi/HAMi-WebUI/blob/main/docs/installation/helm/index.md
部署HAMi-WebUI之前必须先满足以下先决条件:
已经部署好了k8s环境(对k8s版本要求由HAMi版本决定,具体查看HAMi官方安装文档)
已经部署好HAMi环境且其版本>=2.4.0
部署好Prometheus且其版本>2.8.0
部署好Helm且其版本>3.0
(目前官方文档中说明了通过helm安装HAMi-WebUI这一安装途经与工具)
2.1 部署HAMi-WebUI Helm charts
1
2
3
4
5
6
7
8
9
10
11
12
13
14
15
16
17
18
19
20
21
22
23
24
25
26
27
28
29
30
31
32
33
34
35
36
37
38
39
40
# 1.添加HAMi-WebUI repository # 2.使用helm部署HAMi-WebUI(其中externalPrometheus.address参数的值以k8s环境中prometheus实际服务名为准,端口一般都是9090) # 上述命令执行后,会有如下输出 # NAME: my-hami-webui # LAST DEPLOYED: Wed Jan 22 14:46:54 2025 # NAMESPACE: kube-system # STATUS: deployed # REVISION: 1 # TEST SUITE: None # NOTES: # 1. Get the application URL by running these commands: # export POD_NAME=$(kubectl get pods --namespace kube-system -l "app.kubernetes.io/name=hami-webui,app.kubernetes.io/instance=my-hami-webui" -o # export CONTAINER_PORT=$(kubectl get pod --namespace kube-system $POD_NAME -o jsonpath="{.spec.containers[0].ports[0].containerPort}" ) # echo "Visit http://127.0.0.1:3000 to use your application" # kubectl --namespace kube-system port-forward $POD_NAME 3000:$CONTAINER_PORT # 以下是执行"helm install xxx" 前的确认性命令 # 查看与确认k8s环境中prometheus实际服务名与端口 # 确认 prometheus-k8s.monitoring.svc.cluster.local 服务名是否可用 dnstools# dnstools# nslookup prometheus-k8s.monitoring.svc.cluster.local dnstools#
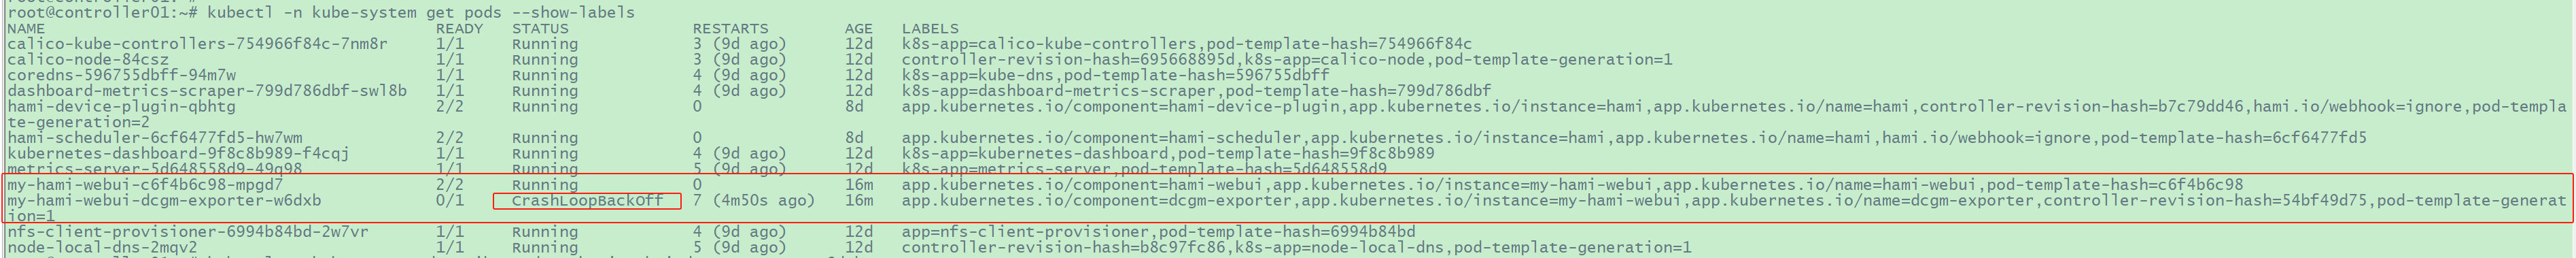
1
2
3
4
5
# 3.执行如下命令确认安装结果 # 其中使用到了镜像“nvcr.io/nvidia/k8s/dcgm-exporter:3.3.7-3.5.0-ubuntu22.04”很可能下载失败
1
2
3
4
5
6
7
8
9
10
11
12
13
14
15
16
17
18
19
# 4.查看svc并修改svc类型为NodePort # 将svc/my-hami-webui 类型由ClusterIP修改为NodePort
2.2 访问HAMi-WebUI
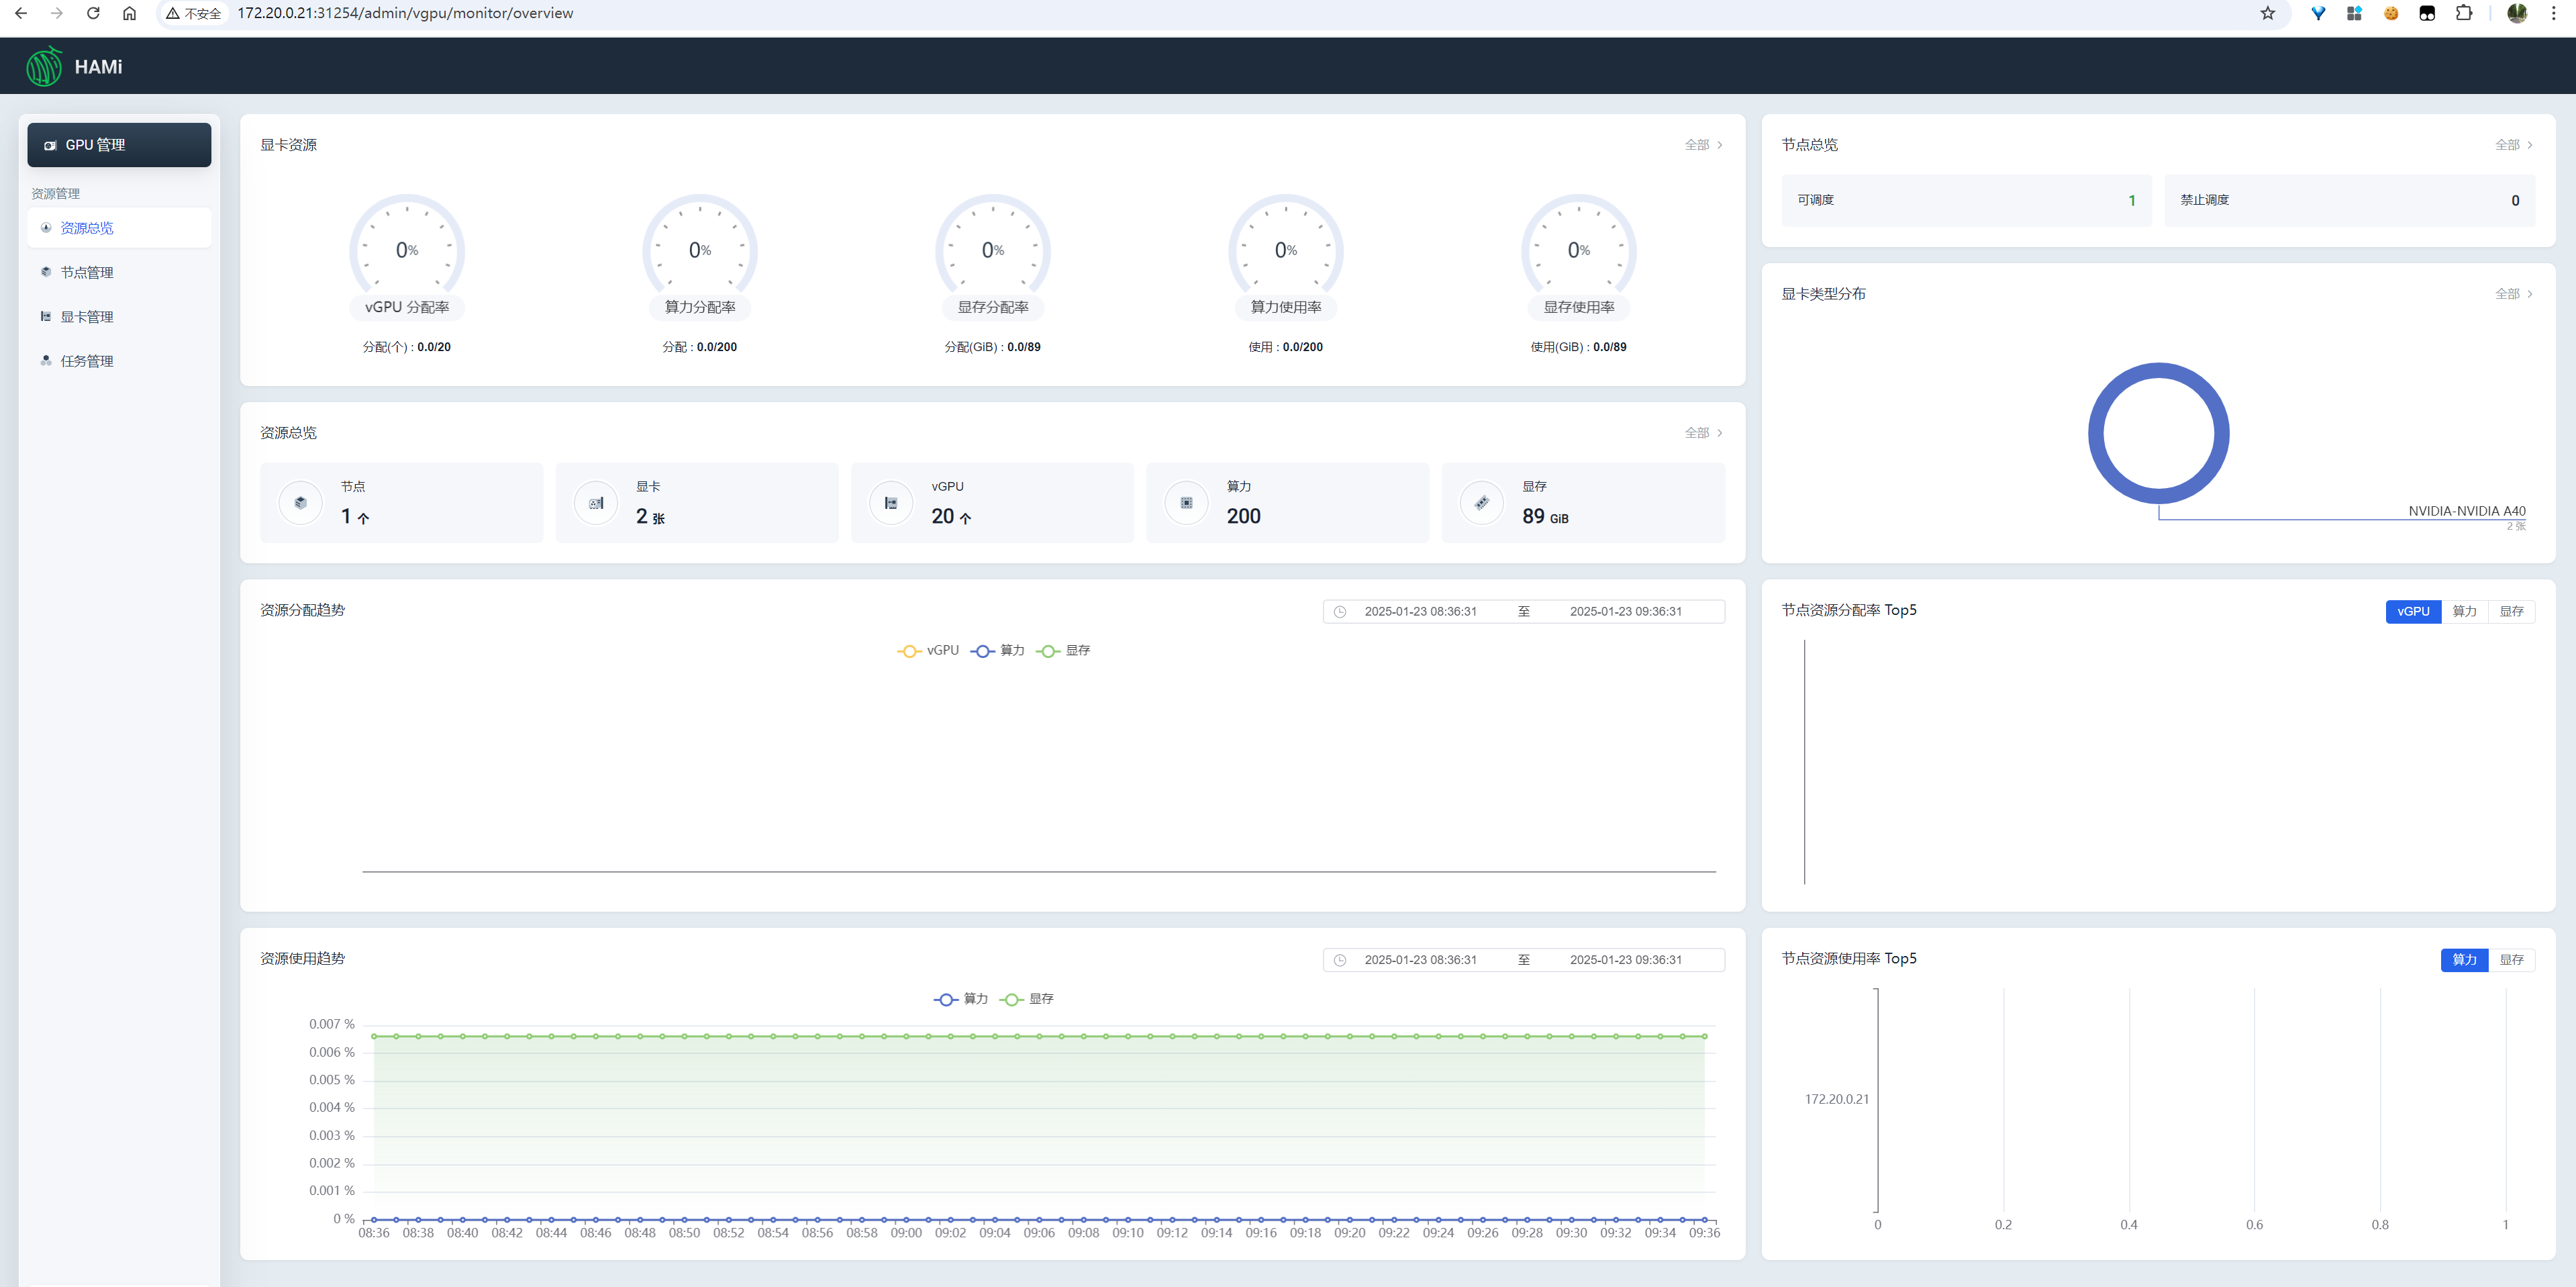
http://{k8s集群任意节点IP}:{svc/my-hami-webui的在k8s节点上的映射端口号},根据上述命令的回显结果,svc/my-hami-webui的在k8s节点上的映射端口号是31254。
如果k8s集群中某个控制节点IP是172.20.0.21,则HAMi-WebUI的访问url是如下:
image-20250123093641069
2.3 卸载HAMi-WebUI
1 root@controller01:~# helm -n kube-system uninstall my-hami-webui
2.4 报错与处理
2.4.1
pod/my-hami-webui-dcgm-exporter提示"Failed to watch metrics: Error
watching fields: The third-party Profiling module returned an
unrecoverable error"
具体问题描述在:https://github.com/Project-HAMi/HAMi-WebUI/issues/20
image-20250122162820887
处理办法:
2025年1月22日:不知如何处理,暂时搁置。社区提问与hami微信群提问,暂时(2025年1月22日)都无人回复,不知道是不是快过年了,大家不上班
2025年1月23日:
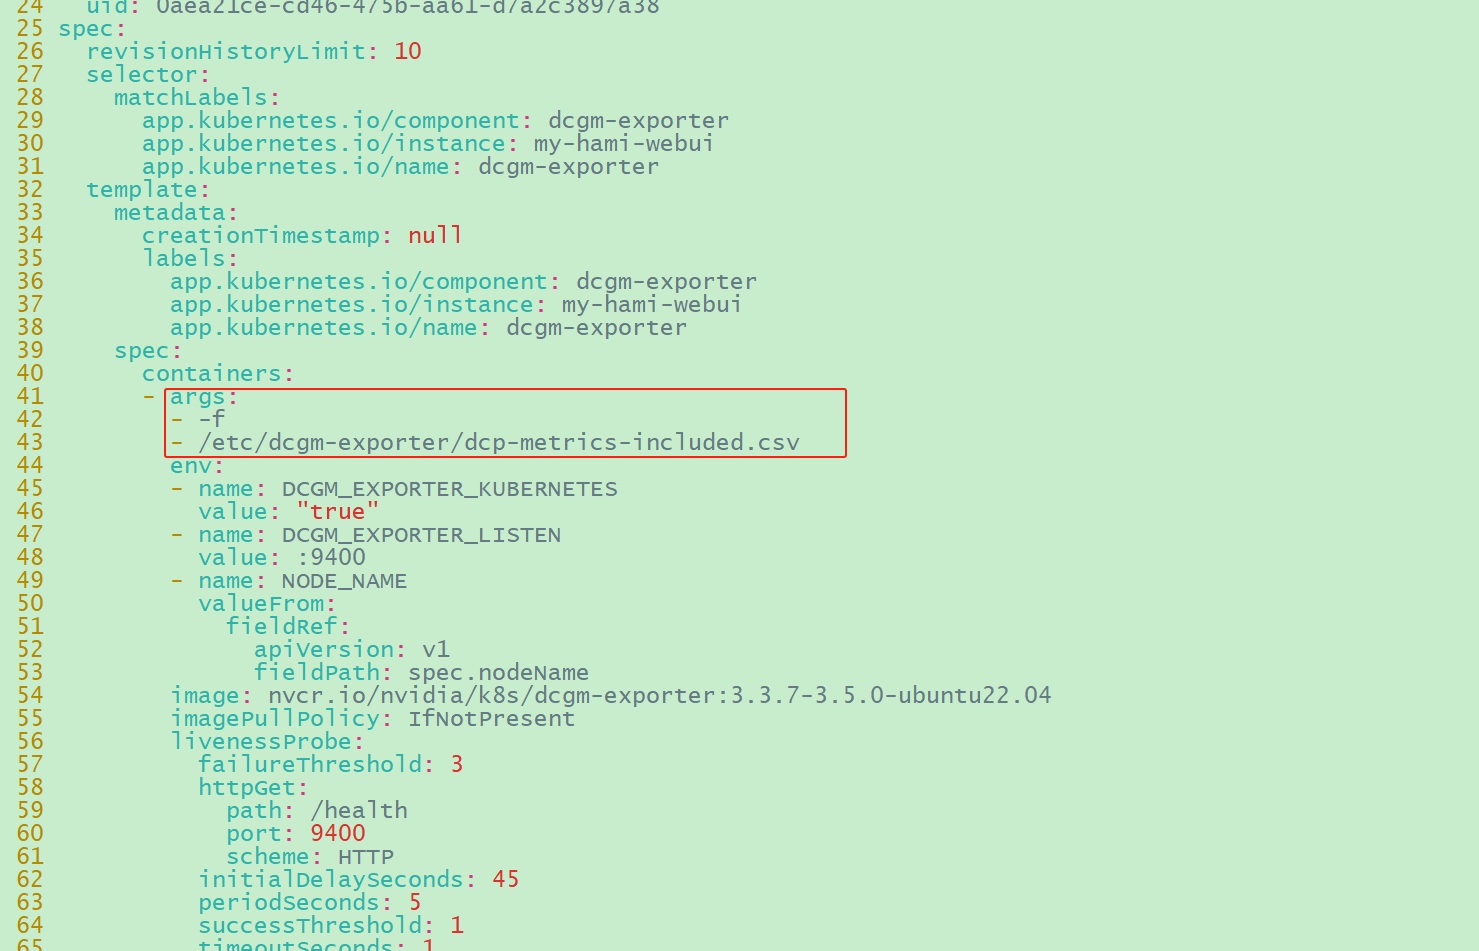
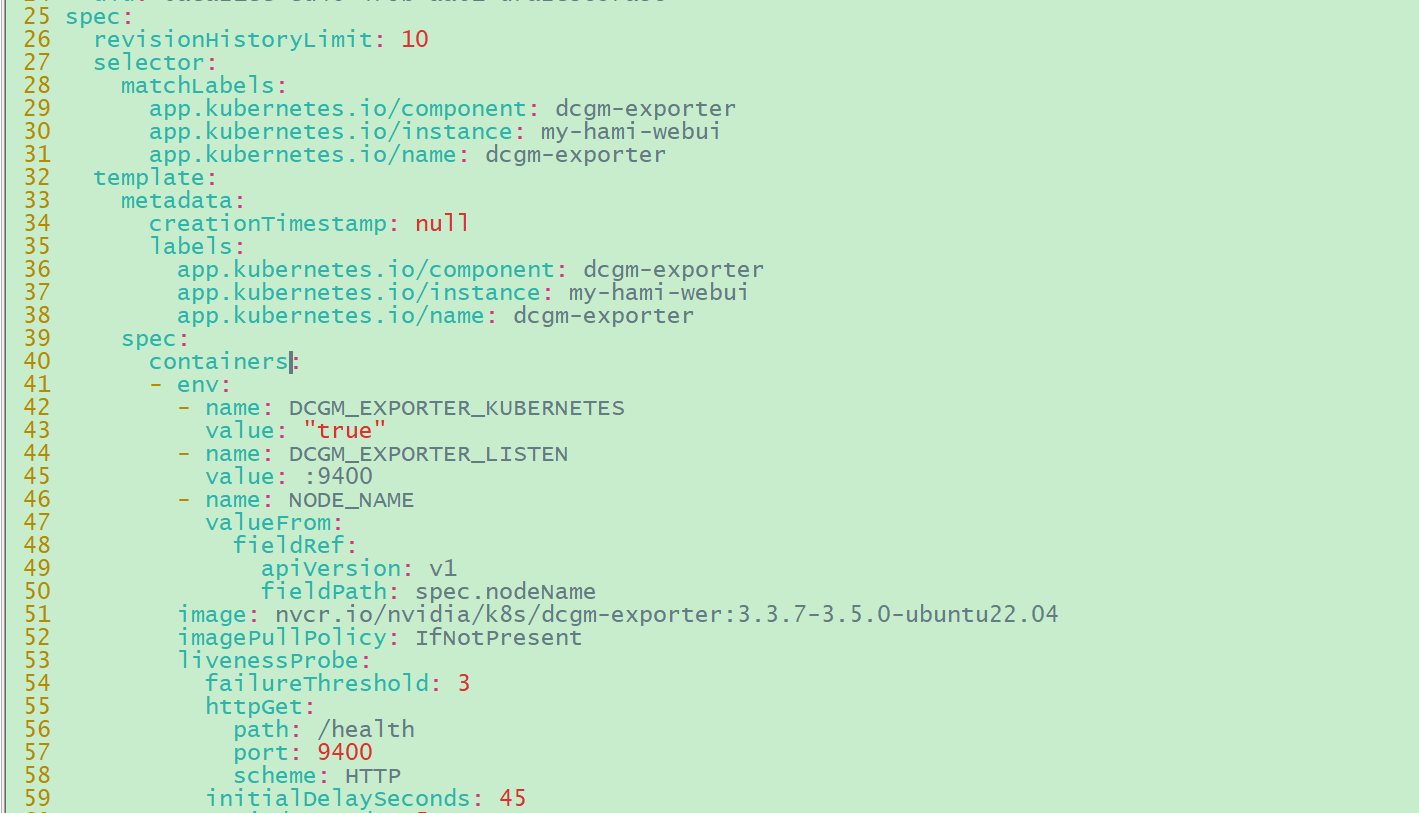
1
2
# 修改daemonsets/my-hami-webui-dcgm-exporter,将参数“args: -f /etc/dcgm-exporter/dcp-metrics-inclueded.csv”去掉
image-20250123092714778
image-20250123092747161
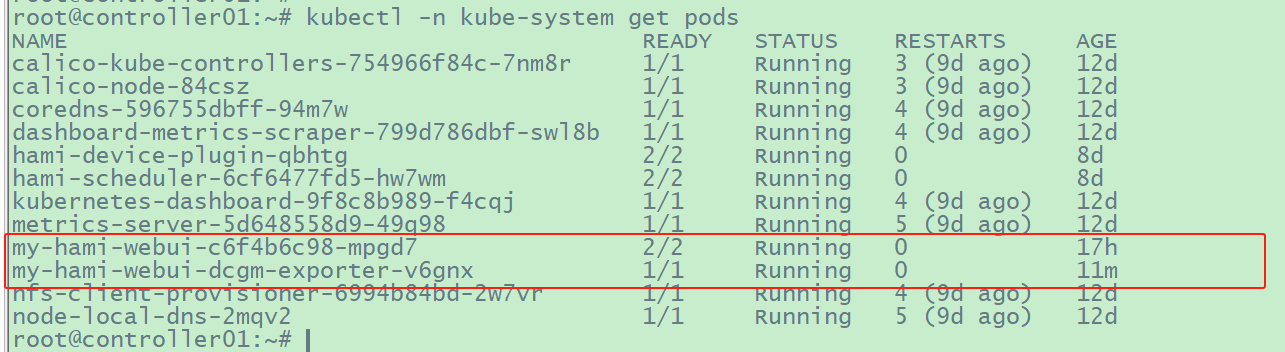
1
2
# 然后可以看到pod/my-hami-webui-dcgm-exporter-v6gnx 正常运行
image-20250123092608635
三、使用
创建任务
1
2
3
4
5
6
7
8
9
10
11
12
13
14
15
16
17
18
19
20
21
22
23
24
25
26
27
28
29
30
31
32
33
34
35
36
37
38
39
40
41
42
43
44
45
46
47
48
49
50
51
root@controller01:/opt/installPkgs/k8s-vgpu-basedon-HAMi# cat gpu-test4.yaml # nodeName: controller01 # nodeName: controller01
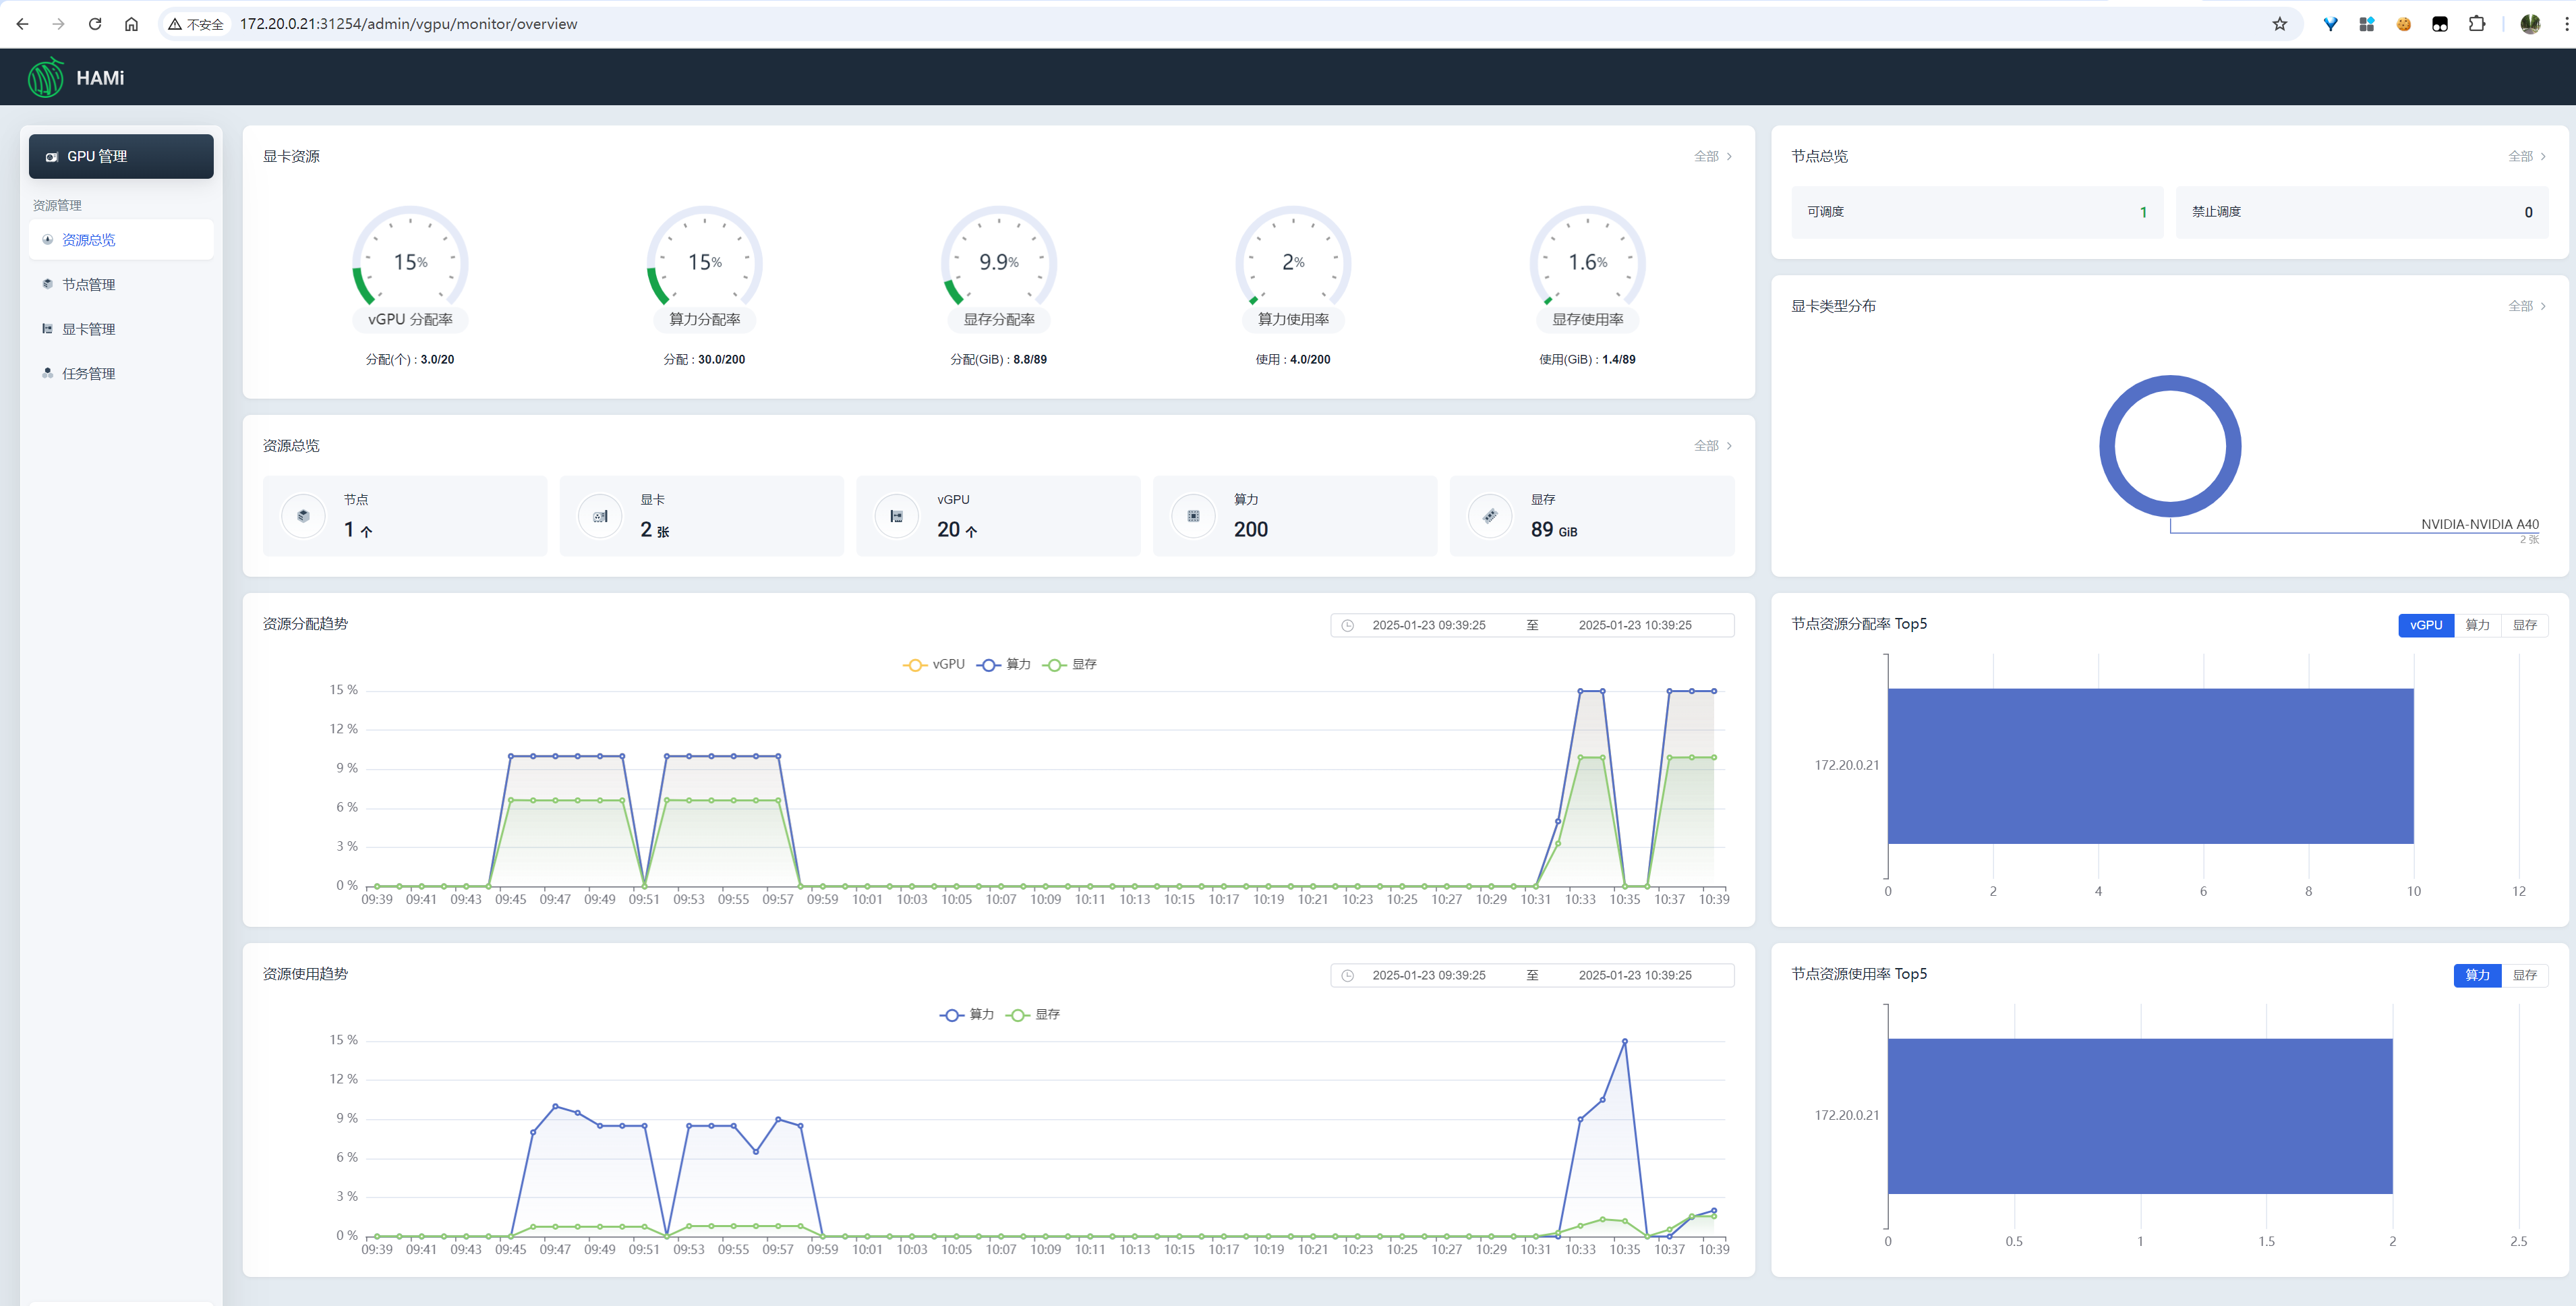
资源总览
image-20250123103935595
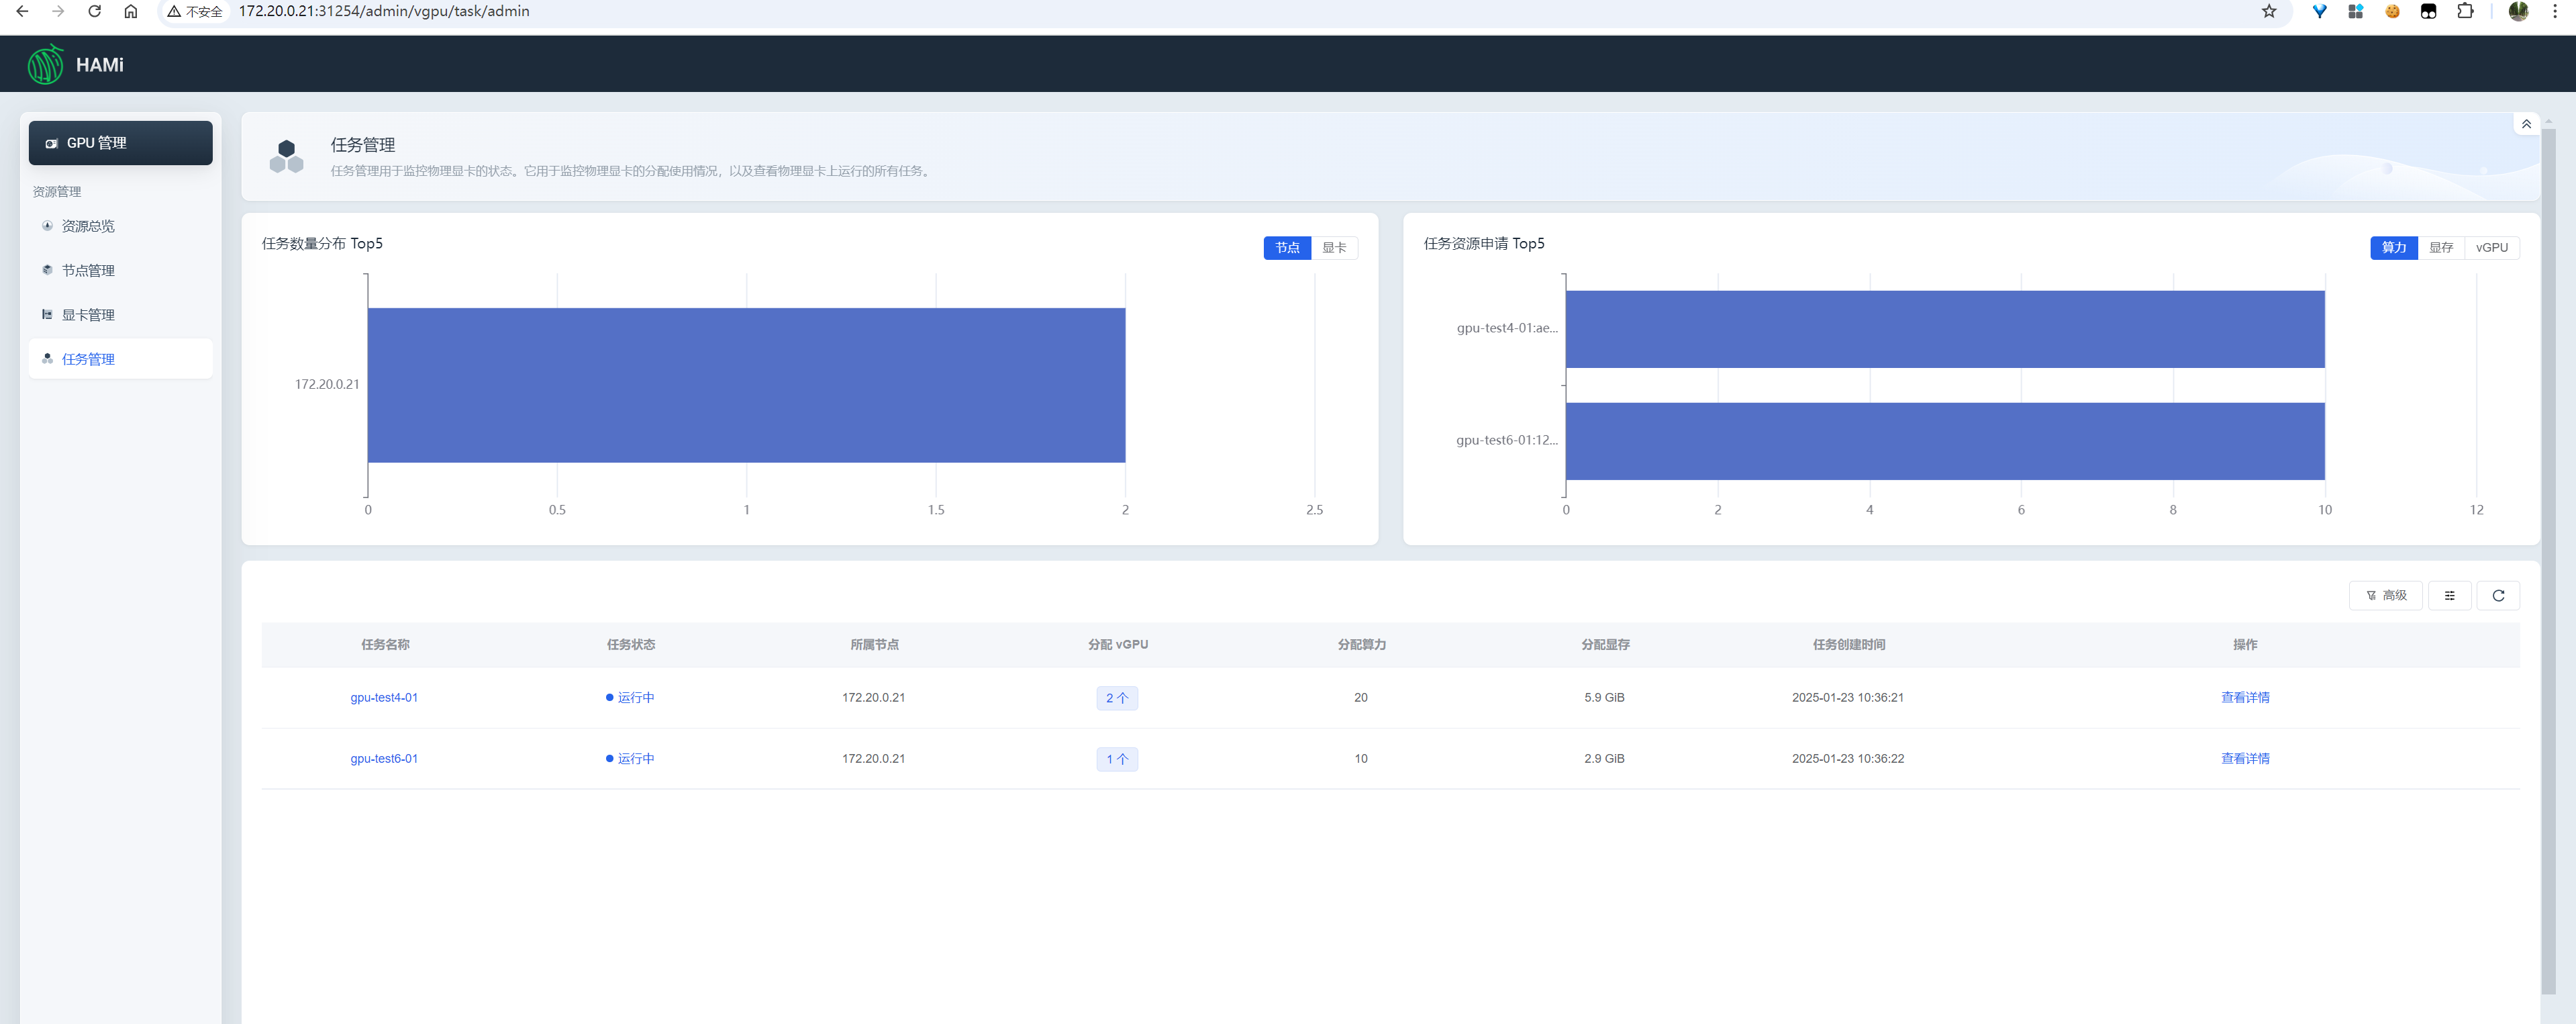
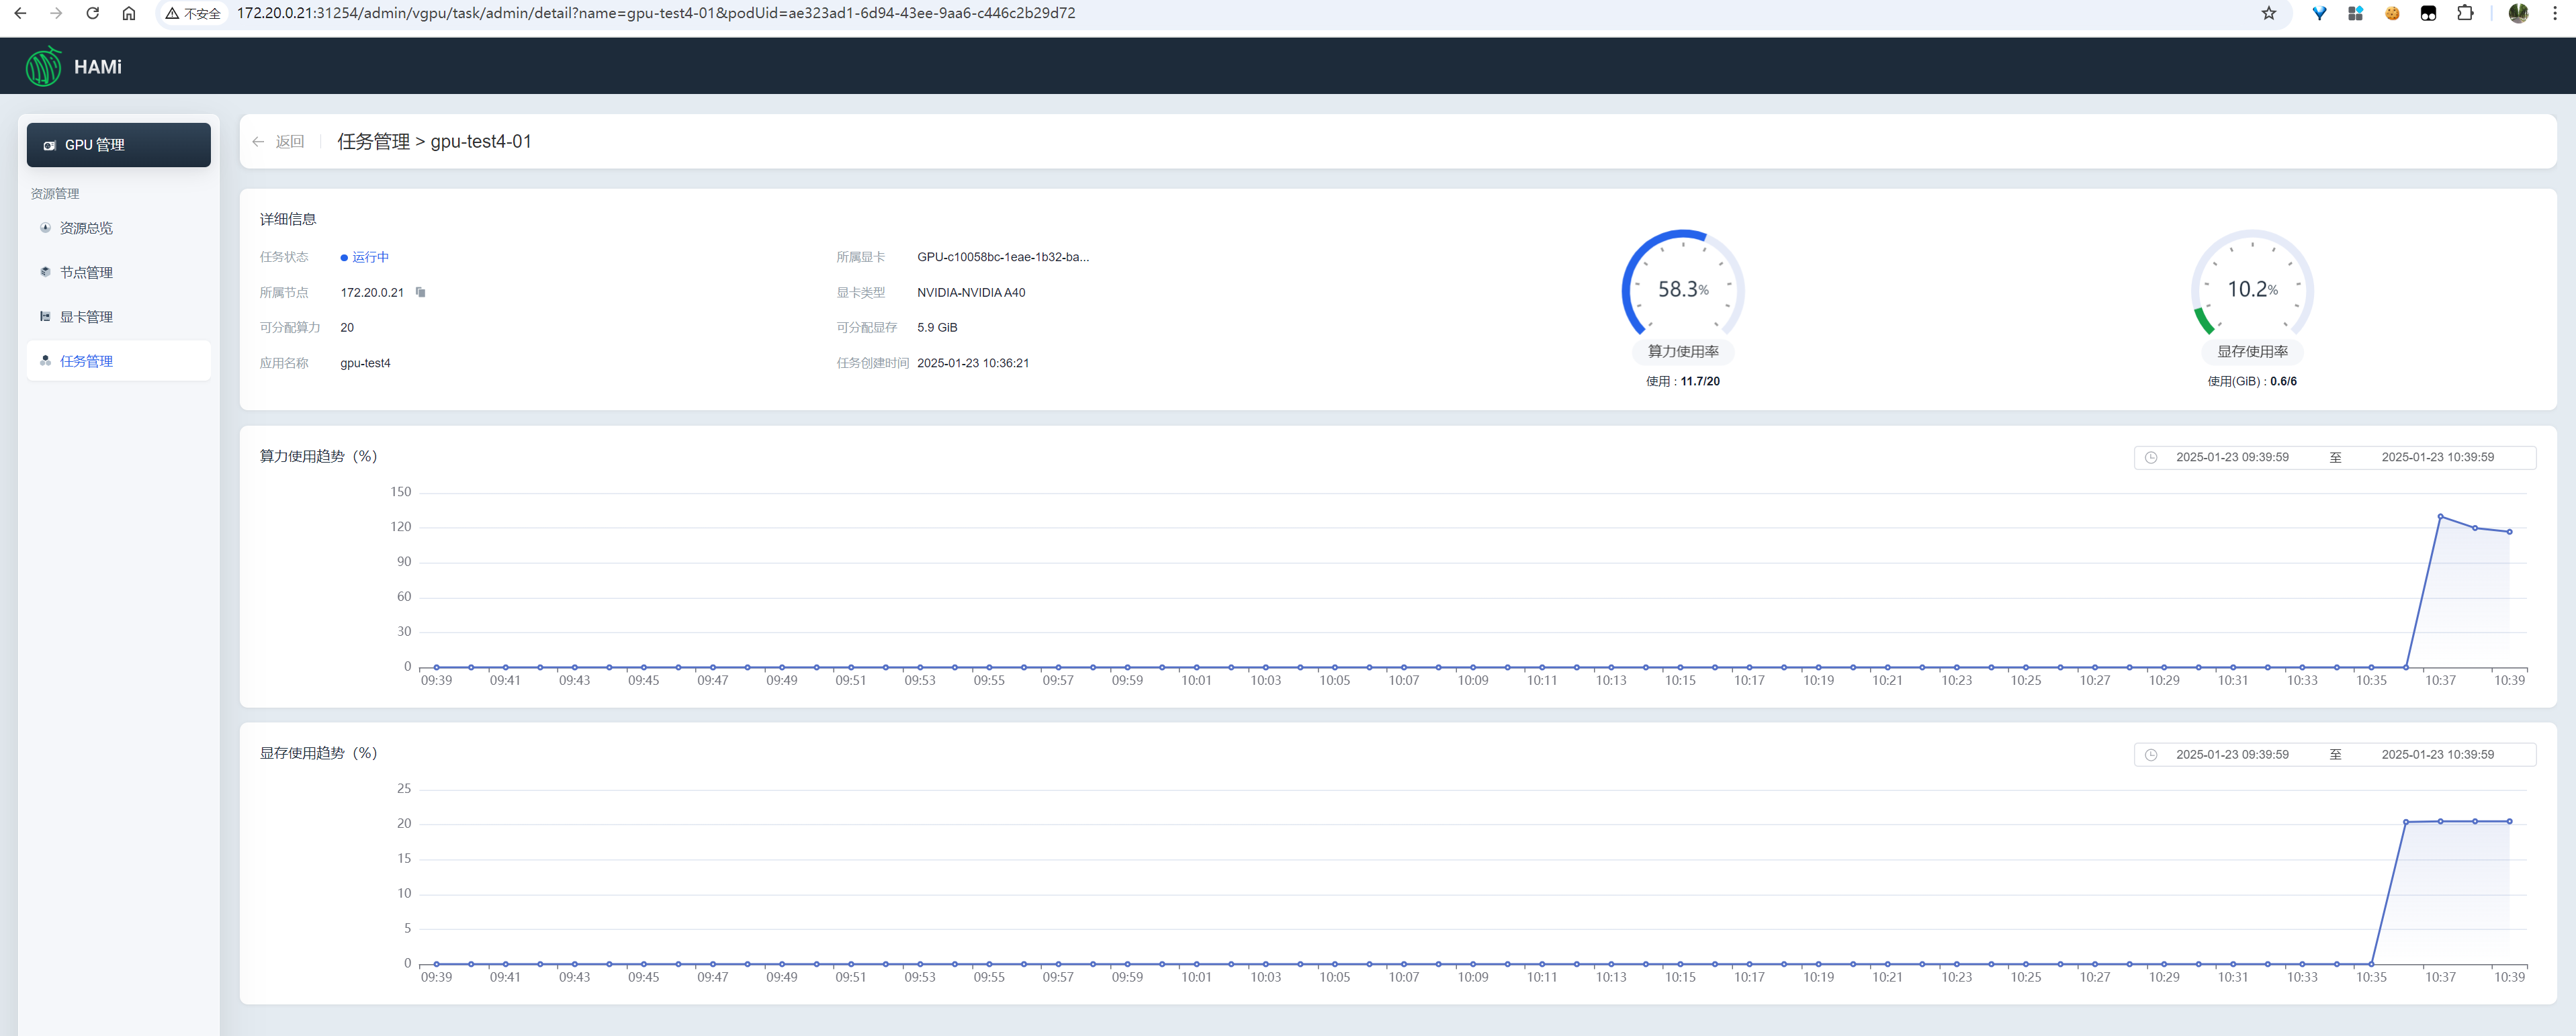
任务管理
查看所有任务的资源使用情况、单个任务的资源使用详情
image-20250123103950833
image-20250123104011189
更多细节分析,待续
四、开源贡献
https://github.com/Project-HAMi/HAMi-WebUI/blob/main/README_ZH.md#%E5%8F%82%E4%B8%8E%E8%B4%A1%E7%8C%AE